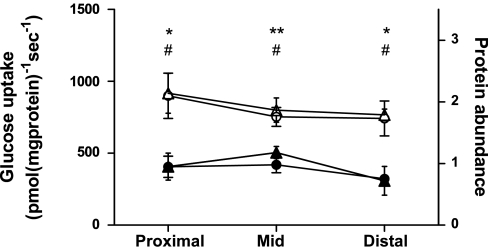
Fig. 6.
Comparison of initial rate of Na+-dependent uptake of d-glucose into BBMV prepared from regions along the length of the small intestine in dogs (○) and cats (●), measured in pmol·mg protein−1·s−1, matched to SGLT1 protein abundance in the same BBMV prepared from dogs (▵) and cats (▴), measured by Western blot and given in arbitrary units. Results are shown as means with SD. Significant difference in initial rate of glucose uptake *P < 0.05, **P < 0.01. Significant difference in protein abundance #P < 0.05.

