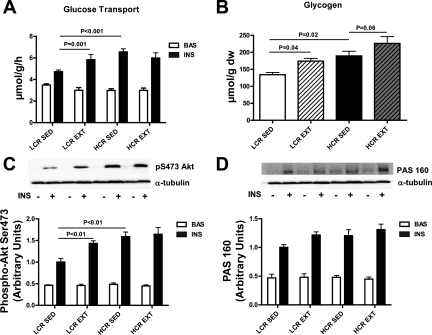
Fig. 1.
Skeletal muscle glucose metabolism in sedentary (SED) and exercise-trained (EXT) low (LCR)- and high (HCR)-capacity runners. A: 3H-3-O-methylglucose transport was measured in the soleus muscle during in vitro incubations. Data are expressed as the rate (μmol·g−1·h−1) of glucose transport in paired muscle strips subjected to basal (BAS) or insulin-stimulated (INS) conditions (mean ± SE, n = 8–10). B: muscle glycogen content was determined in aliquots of freeze-dried/powdered red gastrocnemius muscle and expressed per gram dry weight (dw; mean ± SE, n = 9–10). BAS and INS Akt phosphorylation at Ser473 (C) and AS160 phosphorylation as detected by the phospho-Akt substrate (PAS) antibody (D) were determined by Western blot analysis using α-tubulin as a loading control (mean ± SE, n = 8–10). Significant differences between groups (P < 0.05; mean ± SE, n = 8–10) are shown.

