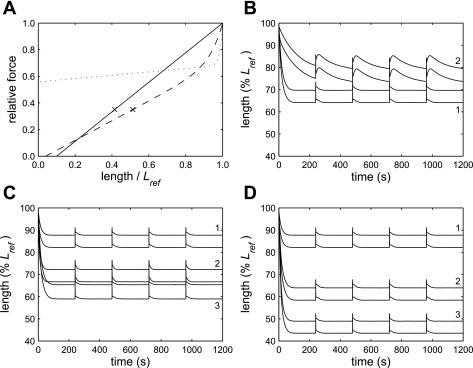
Fig. 5.
Model simulations. A: length-tension relationships used in the modeling: LTR1 (solid line), LTR2 (dotted), LTR3 (dashed). The crosses indicate the final lengths that would be reached by a simulation that shortened to a relative force of 0.35 on LTR1 or LTR3. LTR2 and LTR3 follow the relationship F = aexp(bL) + cL + d, where F is relative force, L is length/Lref, a, b, c, and d are constants, and a was chosen to ensure the relationship went through (1, 1). For LTR2, b = 70, c = 0.125, and d = 0.558. For LTR3, b = 15, c = 0.74, and d = −0.03. B: model simulations performed using different length-tension relationships. The pairs of lines indicate the maxima and minima of each oscillation cycle. When LTR1 was used, the simulation shortened rapidly to a steady-state length and returned to that length after each deep breath (1). A length-time relationship similar to that observed in the experimental data could be reproduced by using LTR2 (2). C: predicted effect of a 50% increase in the isotonic shortening velocity at 0.2 Fiso. Simulations were performed using LTR3. When an increase in isotonic velocity was simulated by increasing the cycling rate of the phosphorylated cross-bridges (3) or by increasing the rate of myosin light chain phosphorylation (2), the predicted total shortening was at least double that in the baseline simulation (1). D: predicted effect of an increase in force-generating capacity. Simulations were performed using LTR3. When a 50% (2) or 100% (3) increase in force-generating capacity was simulated, the predicted total shortening was much greater than in the baseline simulation (1, same as in C).

