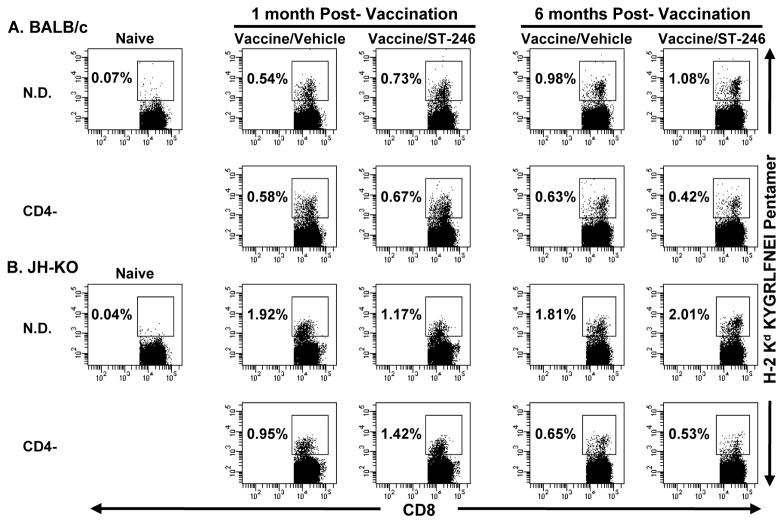
Figure 4. Ex vivo analysis of the magnitude of VV peptide-specific CD8+ T-cell responses.
Single-cell suspensions were prepared from spleens obtained from the same BALB/c (A) and JH-KO (B) immunodeficient mice described in Figure 3, which were sacrificed at one or six-months post-vaccination and concurrent treatment with vehicle or ST-246. Pooled splenocytes from 4-5 mice/group were consecutively stained with KYGRLFNEI (H-2Kd: A52R75-83) peptide-loaded pentamer and anti-CD8 antibody and analyzed by flow cytometry. Dot plots represent CD8+ T cells subgated on live lymphocytes identified by FSC and SSC parameters. Naïve splenocytes were used as negative controls to set the pentamer+ gate. Percentages represent the frequency of pentamer+ cells in the CD8+ T-cell population. Although splenocytes from CD8− and CD8−CD4−/BALB/c and JH-KO mice were also analyzed similarly, their plots are not shown, since the depletion of the CD8+ T-cell population was >99%.

