
Figure 6.
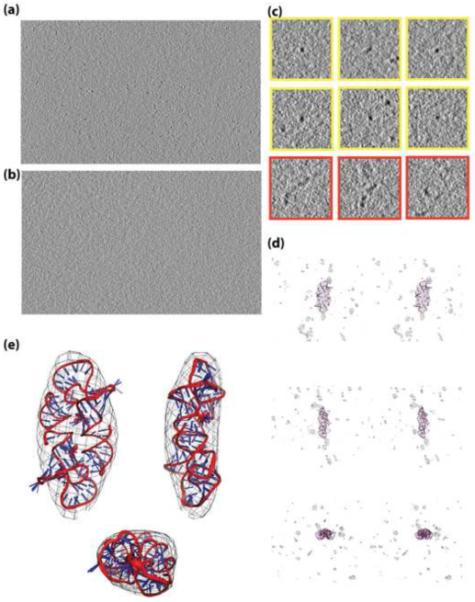
(a) A projection though 15 slices of a tomogram of [ΨCD]2. The dark densities are proposed to correspond to molecules of [ΨCD]2. They consist of individual compact point-like densities, multiple adjacent densities, and extended multimers when viewed in projection. Only subvolumes corresponding to well separated, compact densities were chosen for further processing. (b) A projection though 15 slices of a tomogram of buffer (the same buffer used for NMR studies). Wavy texture is most likely due to irregularities in the surface, since this texture is more prominent at the air-ice interface. There are no distinguishable compact densities present. Some ice contamination is also visible. (c) Two dimensional views of representative densities that were utilized for further analysis (yellow); densities attributed to higher molecular weight multimers, which were not utilized for further analysis, are also shown (red). Point-like densities in this projection were then examined in 3D to verify that they were also compact in the third dimension. (d) Stereo views of one representative subvolume out of those chosen for 3D alignment and averaging, shown from three different angles. A representative [ΨCD]2 NMR structure is fitted into the density for comparison. The surrounding noise is representative of the noise around all chosen particles. (e) Orthogonal views of the averaged cryo-ET subvolumes fitted to the ensemble of [ΨCD]2 NMR structures. The overall shape and dimensions of the averaged cryo-ET density is in good agreement with the structure calculated by NMR. Although U319 resides outside of the averaged cryo-ET density, this residue is disordered in the NMR structure and appears to undergo rapid conformational averaging.