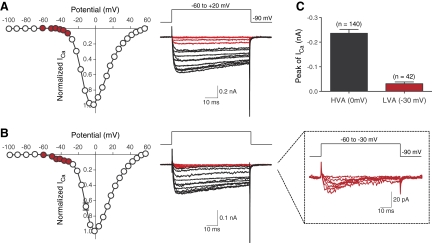
Fig. 4.
Whole cell ICa from R-B neurons with and without a LVA current component. A and B: mean normalized (to maximal amplitude) Ca2+ current-voltage (I-V) relationships (left). Each symbol represents the mean ± SE. of 9 (A) or 10 (B) neurons, respectively. Current traces (right) were evoked by a series of voltages steps to potentials ranging between −100 and +60 mV from a holding potential of −90 mV. For illustrative purposes, only traces from −60 to −20 mV are shown. Red colored traces in each group represent ICa components at low-voltage potentials (approximately −60 to −30 mV) in I-V relationships (red circles). Enlarged LVA-ICa traces are shown to emphasize transient current trajectory (B, right inset). C: bar graph represents the mean amplitudes of HVA- and LVA-ICa. The number of neurons tested is shown in parentheses.

