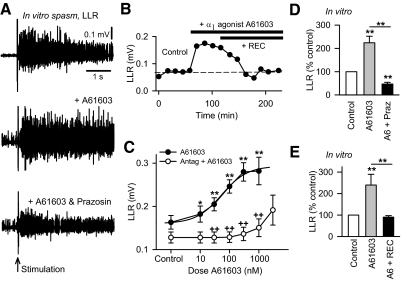
Fig. 2.
The α1A adrenergic receptor agonist A61603 is antagonized by selective α1 receptor antagonists. A: LLR evoked in the isolated in vitro spinal cord of a chronic spinal rat, as described in Fig. 1 (top plot), with bath application of the α1A receptor agonist A61603 (0.1 μM, middle plot), and with subsequent application of α1 receptor antagonist prazosin (1 μM, bottom plot). B: amplitude of LLR (quantified 0.5–4 s post stimulus, as in Fig. 1) of a chronic spinal rat measured repeatedly over time under control conditions (left), with application of A61603 (upper horizontal black bar; 0.03 μM) and subsequent application of the highly specific α1A receptor neutral antagonist REC15/2739 (abbreviated REC; lower horizontal black bar; 10 μM). C: mean LLR amplitude in response to increasing doses of A61603 (dose response) recorded in chronic spinal rat in vitro (●, upper line; n > 18 for each dose) and for A61603 applied after the α1 receptor antagonists prazosin (1 μM) or WB4101 (3 μM) (○, lower line; n > 8 for each dose, ++P < 0.01). D: normalized group mean of LLR with application of A61603 alone (0.03–0.3 μM;  , n = 42) and A61603 with subsequent treatment with prazosin (abbreviated A6 + Praz; ■, n = 16), recorded in chronic spinal rat in vitro. E: same as D except treatment with A61603 alone (0.03 μM; n = 15), and A61603 with subsequent application of REC15/2739 (abbreviated A6 + REC; 10 μM; n = 15). *P < 0.05, **P < 0.01. Error bars, SE. All recordings were made in the presence of RX821002 (0.5 μM).

