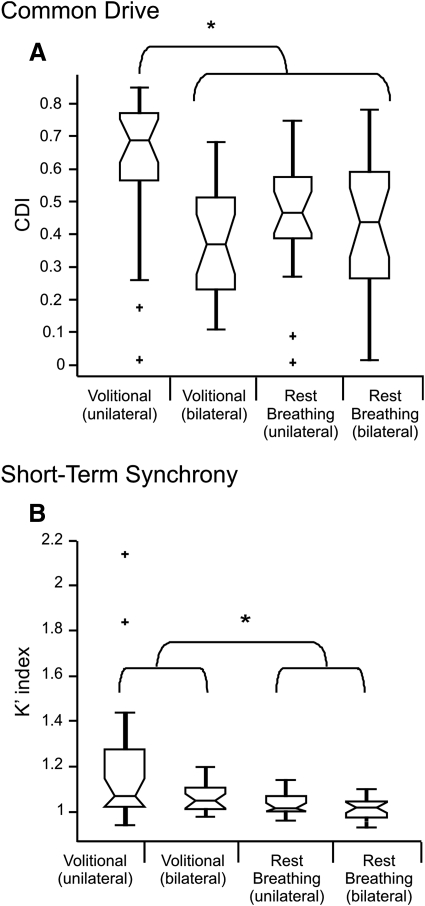
Fig. 2.
Differences in short-term synchrony and common drive across task conditions. A: how common drive, quantified as the CDI, varied across recording conditions. The distribution of CDI values are displayed as a box-and-whisker plots, with each plot showing the median CDI value (midline), inter-quartile range (box and whiskers), and outliers (+). Statistical comparison across groups was accomplished using a Kruskal-Wallis ANOVA with Tukey's HSD post hoc tests for pairwise comparisons. Significant differences between groups are marked with an asterisk (*). B: the results of the short-term synchrony analysis, quantified by the K′ index. The highest CDI and K′ values were measured from unilaterally located units recorded during tongue protrusion.

