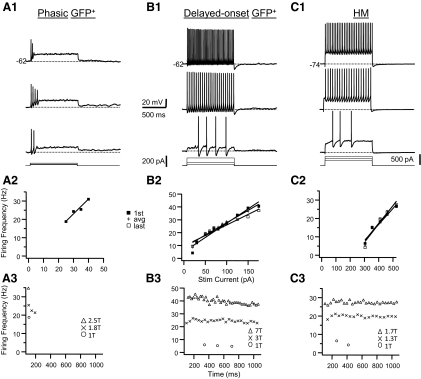
Fig. 7.
Examples of the firing patterns in response to step current pulses for a phasic interneuron (A), a delayed onset interneuron (B), and an HM (C). Top panel (A1–C1): for each cell membrane voltage responses to 1,000-ms-long depolarizing current pulses at 3 different amplitudes are shown. Current amplitude increases from bottom to top. The smallest current pulse that resulted in repetitive firing is the threshold current (1T). Resting membrane potential is indicated in the top trace of each panel. Middle panel (A2–C2): relationship between instantaneous firing frequency and current amplitude (f–I plot) for the cells shown in the top panel. Plotted are the firing frequency for the first spike interval in the train (first; filled squares), last interval (last; open squares), and average frequency (avg; pluses). For the phasic cell only the first spike interval frequency is shown. Graphs for first, last, and average frequencies and current amplitudes were fitted with straight lines. Bottom panel (A3–C3): relationship between the instantaneous firing frequency and the time from the start of the pulse (f–t plot) for the cells shown in the top panel. For each cell the f–t plots at 3 different current amplitudes (expressed as multiples of the threshold current) are shown corresponding to the 3 traces in the top panel. Note the long delay to the first spike in the train at 1T current amplitude for the delayed onset cell and the HM cell. These 2 cell types also showed relatively little spike frequency adaptation.

