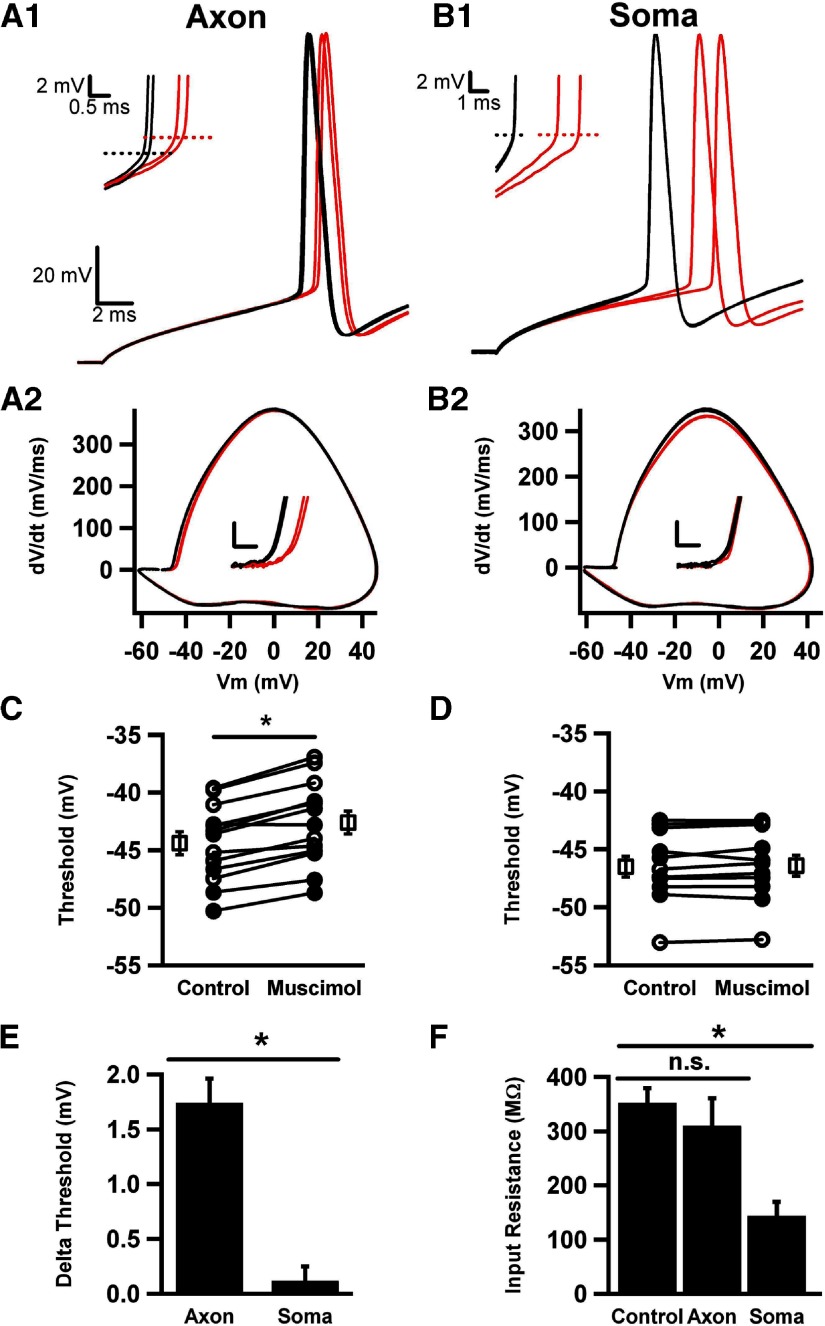
Fig. 2.
Effects of moderate axonal and somatic activation of GABAA channels. A1: AIS applications of 5 μM muscimol (red traces) depolarized the voltage threshold compared with control (black traces). Inset: magnification of the action potential early upswing, with dotted horizontal lines indicating the average threshold voltage. A2: phase plots of control (black) and muscimol-conditioned (red) action potentials shown in A1. Inset: magnification of the rising part of phase plot, calibration bars are 10 mV/ms and 2 mV. B1: somatic muscimol application produced a delay in action potentials without affecting voltage threshold (inset, same calibration as in A1). B2: phase plots of traces shown in B1. Notice the change in the peak dV/dt, without an effect on voltage threshold (inset, same calibration as A2). C and D: summary of AIS (C) and somatic (D) muscimol applications, with every dot pair representing a single cell (n = 13). Closed symbols represent 5 μM muscimol; open symbols represent 10 μM muscimol. E: change in voltage threshold in response to axonal and somatic muscimol, from C and D. F: input resistance under control (no application), axonal, or somatic muscimol application (n = 5), n.s., not significantly different.

