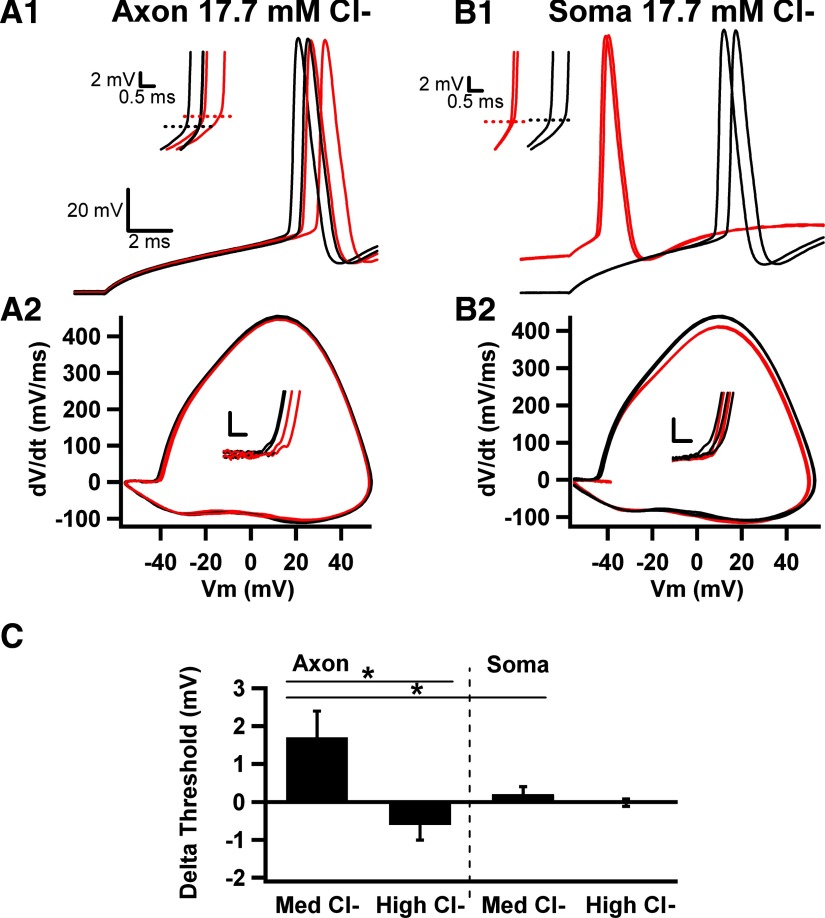
Fig. 4.
Altered AIS voltage threshold effects with varied intracellular [Cl−]. A1: local muscimol applications with pipette [Cl−]i elevated from 5 (Figs. 1–3) to 17.7 mM still depolarized voltage threshold. Red traces are muscimol; black traces are interleaved control sweeps. Inset: magnification of action potential upswing shows the depolarized threshold. A2: phase plots from traces in A1 in presence (red) and absence (black) of muscimol applications to the AIS. Inset: change in voltage threshold, calibration bars are 10 mV/ms and 2 mV. B1: in the same cell as A1, somatic muscimol application (red traces) depolarized membrane voltage before current injection but did not alter threshold (inset). B2: phase plots from traces in B1 in presence (red) or absence (black) of somatic application. Notice the decrease in peak dV/dt with muscimol, without changes in threshold (inset). C: summary of action potential threshold changes for control and muscimol application during axonal and somatic applications with a pipette Cl− concentration of 17.7 mM (Med Cl−; n = 8). The bar graph also shows the lack of significant overall change in threshold for 18 cells filled with 33.4 (High Cl−; n = 18 for axons and 6 for somas), so that GABAA receptor activation was explicitly excitatory.

