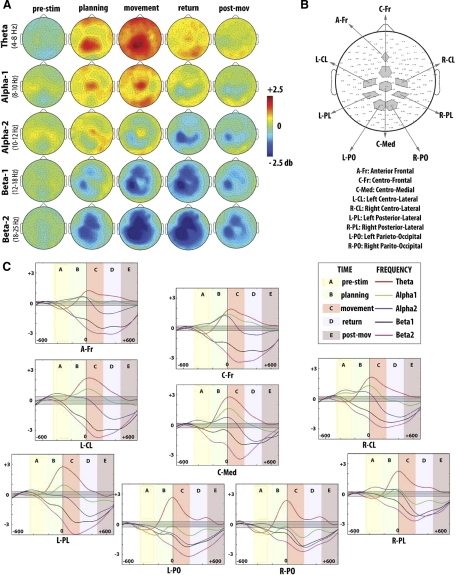
Fig. 2.
Findings obtained in the event related spectral perturbation (ERSP) analysis. A: group-mean ERSP for the 5 selected frequency bands are plotted on the scalp at the different time intervals of interest. B: the 9 scalp regions of interest (S-ROIs) that were selected on the basis of the ERSP activation patterns. The S-ROIs are depicted in gray along with the corresponding electrodes. C: time course of the ERSP calculated on the group for the 9 scalp S-ROIs and significance limits (in gray) obtained with bootstrap statistic (P < 0.01).

