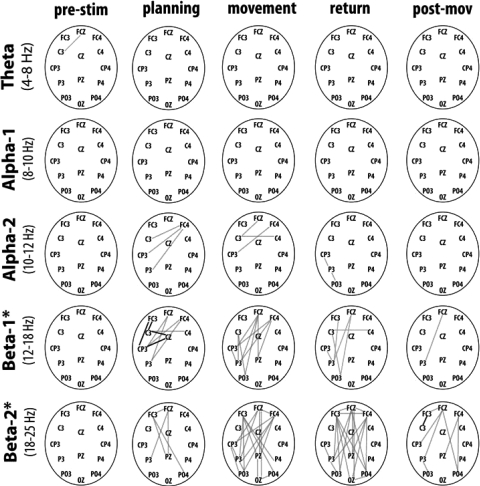
Fig. 3.
Findings obtained in the phase coherence analysis. The different line plotted on the scalp indicates those channel pairs showing significant increase or decrease of coherence values in comparison to the baseline. The coherence variations are plotted for the different time intervals of interest. Gray lines, a significant decrease; black lines, a significant increase (Statistical nonparametric procedure using suprathreshold cluster analysis for multiple comparisons, P < 0.05). Asterisk, for the beta frequency bands, the lines show significant increase/decrease of coherence values in comparison to both the baseline and PreStim time intervals.

