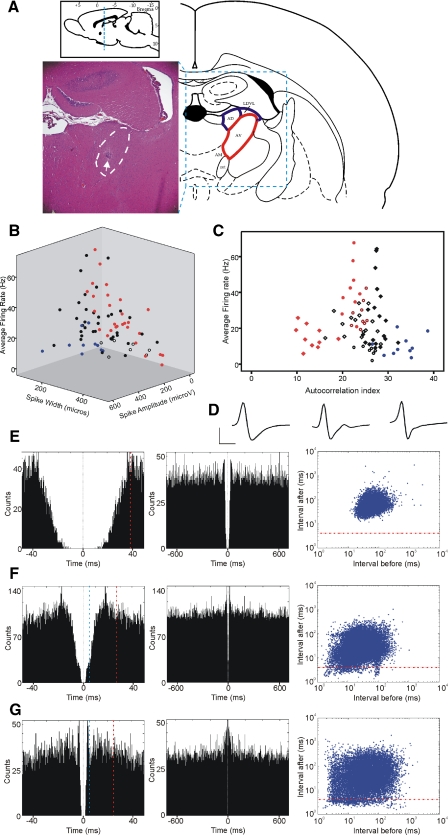
Fig. 1.
Properties and distribution of major anteroventral nucleus (AV) neuron classes. A: Nissl-stained coronal brain section from a rat where four chronically implanted tetrodes targeted the AV (highlighted with white dashed line). White arrow, the tip of the tetrodes surrounded by a small area of gliosis. The histological section lies within coronal plane with anterio-posterior coordinates of −1.7 ± 0.2 mm from Bregma (top inset). Rat AV (marked with red on the atlas schematic, right) is located ventrally to the anterodorsal nucleus (AD) and laterodorsal thalamic nucleus, ventrolateral part (LDVL; both nuclei marked with blue). B: 3-dimnensional (3D) scatter plot of electrophysiological parameters for 80 AV neurons (9 rats), recorded during behaviorally active periods. We used 3 parameters to represent AV characteristics: average firing frequency (Hz), spike width (μs), and spike amplitude (μA). Nonbursting units are blue, theta-rhythmical units red, nonclassified units are white, and nontheta bursting units are black. Although spike amplitude depends on the proximity of the tetrode to the recorded unit, we have included this parameter because of its characteristically low values for theta-rhythmic units (143 ± 43.8 μA). C: AV neuronal diversity: we plot here the average firing rate (y axis) against the mean value (1st moment) of the spike autocorrelogram (Csicsvari et al. 1998), the autocorrelation index (x axis). All unit classes formed distinct clusters: slow-spiking theta bursters (red rectangles, n = 10); fast spiking theta bursters (red dots, n = 9); theta-modulated bursters (brown circles, n = 9); low-probability bursters (black rectangles, n = 19); nonbursters (blue dots, n = 10). The exceptions were high-probability nontheta bursters (white rectangles, n = 16), which had a less-defined distribution. Finally, nonclassified neurons are presented as white circles (n = 7). D: representative waveforms for the main AV classes described below: nonbursting (left), low-probability bursing (middle), and high-probability bursing (right) neurons. Horizontal scale bar: 300 μs, vertical bar 300 μV. E: firing properties of nonbursting AV unit from 16 min recording during active behavioral state. Left image: an example of 50 ms autocorrelogram; dashed vertical red line, the value of autocorrelation index. Middle image: 700 ms autocorrelogram of the same unit. Right image: 2D log-scale interspike interval (ISI) scatterplot for the same neuron. The points below the dashed horizontal red line represent the action potentials within bursts. F: representative example of 50 ms (left) and 700 ms (middle) autocorrelogram and ISI scatterplot (right) for low-probability bursting AV unit. G: representative example of 50 ms (left) and 700 ms (middle) autocorrelogram and ISI scatterplot (right) for high-probability bursting AV unit. The distance between time 0 and 1st 5 ms (marked with blue vertical dashed line) in the 50 ms autocorrelogram denotes the proportional number of spike counts within the bursting range.

