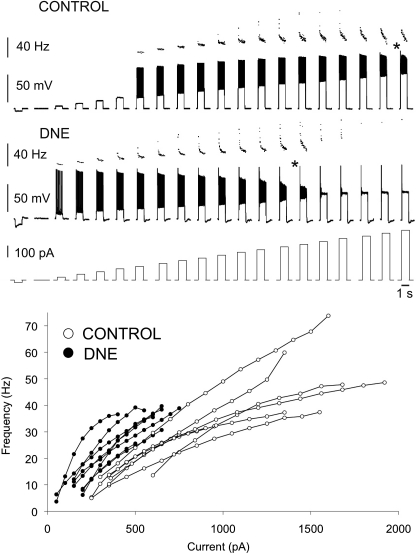
Fig. 5.
Effects of DNE on the intrinsic excitability of XII MNs recorded in nonrhythmic medullary slices. A, top: recordings from a representative XII MN from a control and DNE animal. For each MN, the voltage response and instantaneous discharge frequency are shown. The bottom trace in this panel is common to both cells and shows the current steps applied to all XII MNs studied (i.e., 20 square wave pulses lasting 1 s). Current injection began with a single −50-pA hyperpolarizing pulse followed by 19 depolarizing pulses increasing by 50 pA with each step. Note that all cells were driven until depolarization block was produced (indicated by asterisks). Frequency measurements were made over a 0.5-s window during the last 500 ms of each current step. B: frequency–current (f–I) relationships of control (open circles) and DNE (closed circles) cells to increasing steps of injected current. DNE animals had a lower threshold current, a lower maximum current, and an increase in the slope of the f–I relation.

