Fig. 3.
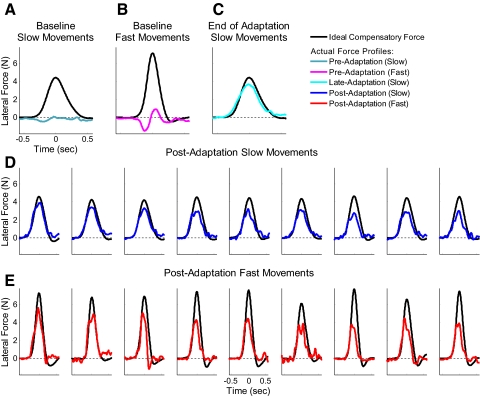
Evolution of force profiles associated with motor adaptation during the baseline, training, transfer, and decay periods of the experiment. Lateral force patterns for (A) slow movements and (B) fast movements before the adaptation period and (C) late in the adaptation period after adaptation levels had reached asymptote of ∼80% of the ideal force. Lateral force patterns for (D) the 1st 9 slow trials and (E) the 1st 9 fast trials during the postadaptation period are displayed in the bottom 2 rows. The black trace in each panel is the ideal compensatory force pattern based on the force field perturbation that we applied, whereas the actual lateral force patterns we measured in each condition are represented by colored traces. Note the substantial transfer of adaptation to the fast movements in the postadaptation block and the parallel patterns of decay for the slow and fast movements during this block.

