Fig. 5.
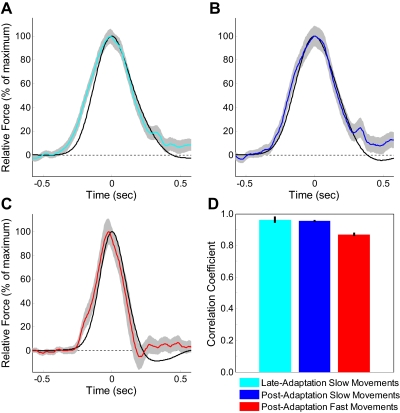
Comparison of the shapes of actual and ideal force profiles for slow and fast movements. To examine the shape of each force profile independent of its magnitude, we normalized each by its maximum. Force profiles shapes are shown for (A) slow movements near the end of the adaptation period and (B) slow and (C) fast movements in the postadaptation period. In each panel, the black trace is the ideal compensatory force, the colored traces represent the actual force produced by subjects, and the gray shaded region represents the SE around the latter. D: correlation coefficients for the data presented in A–C. The vertical black bars represent SE.

