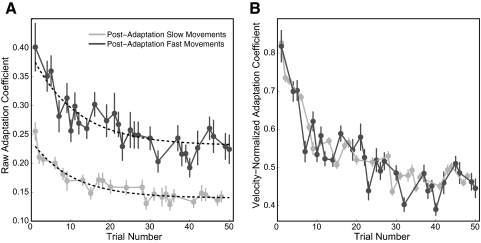
Fig. 6.
Parallel decay of performance in the postadaptation period for fast and slow movements. A: decay of raw adaptation coefficients as a function of trial number. The black dashed lines are the exponential fits to the data (with time constants of 11.4 and 10.3 trials for fast and slow movements, respectively). B: velocity-normalized adaptation coefficients for the same data presented in A. Data for fast movements are shown in dark gray and slow movements in light gray. The error bars represent SE across subjects.

