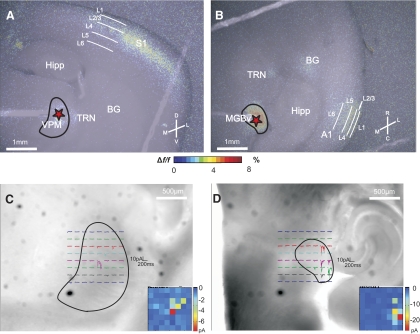
Fig. 1.
Slice connectivity verified using flavoprotein autofluorescence (FA) imaging and photo-uncaging of glutamate. Two typical examples where 20 Hz electrical stimulation (150 μA) of ventral posterior medial nucleus (VPM) and ventral division of the medial geniculate body (MGBv) (red asterisks) resulted in FA activation in layer 4 and layers 2/3 of S1 (A) and A1 (B), respectively. Color scale represents the %Δf/f change in fluorescence. Examples of inward currents recorded from layers 2/3 cells located in S1 (C) and A1 (D) while photo-uncaging glutamate over VPM and MGBv, respectively. Insets: false-color maps of location and magnitude of inward currents. Each pixel corresponds to a locus of uncaging as seen in the main figure. M, medial; L, lateral; D, dorsal; V, ventral; R, rostral; C, caudal; Hipp, hippocampus; TRN, thalamic reticular nucleus; BG, basal ganglia; L1, layer 1; L2/3, layers 2/3; L4, layer 4; L5, layer 5; L6, layer 6.

