Fig. 5.
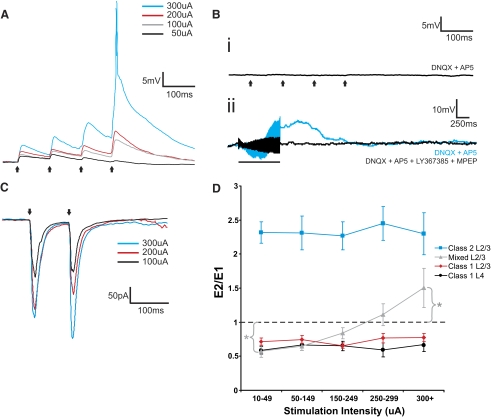
Examples of Mixed responses from cells in layers 2/3 of S1 and A1. A: the short-term plasticity profile of a Mixed response recorded from S1 changed depending on the intensity of stimulation in VPM. At lower stimulation intensities, the cell responded with paired-pulse depression, whereas at higher stimulation intensities, it responded with paired-pulse facilitation. Increasing stimulation intensities produced increases in EPSP amplitudes. Bi: stimulation at 10 Hz (250 μA) in the presence of ionotropic receptor antagonists (DNQX and AP5) failed to produce any EPSPs. Bii: HFS (125 Hz, 200 μA) in the presence of DNQX and AP5 produced a slow and prolonged membrane depolarization (blue trace) that could be blocked with a cocktail of type 1 (LY367385) and type 5 (MPEP) metabotropic glutamate receptor antagonists (black trace). C: voltage-clamp recordings in a cell of A1 while stimulating MGBv at 10 Hz. At lower stimulation intensities, the cell responded with paired-pulse depression, whereas at higher stimulation intensities, it responded with paired-pulse facilitation. Increasing stimulation intensities produced increases in excitatory postsynaptic current (EPSC) amplitudes. Arrows represent timing of stimulation for all 10 Hz trials, and the black bar represents the duration of stimulation in the HFS trial. Excluding the HFS trial, all traces represent the average of 10 sweeps. D: changes in the E2/E1 ratio across stimulation intensities. Lines represent averages within each type of cells from both S1 and A1 (Error bars are SE). Whereas the E2/E1 ratios of cells exhibiting pure Class 1 and 2 responses remained either above or below 1 across stimulation intensities, for cells exhibiting Mixed responses, there was a transition from below 1 to above 1 as stimulation intensity increased. Wilcoxon's 1-sample rank sum tests: *P < 0.05.

