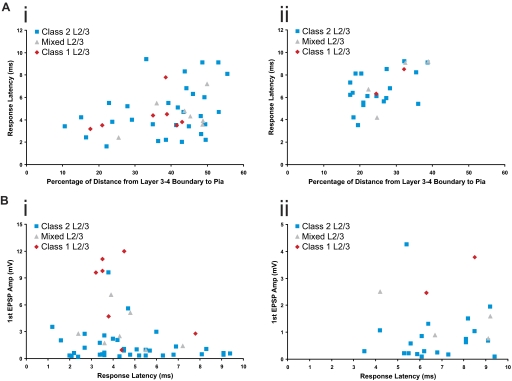
Fig. 7.
Laminar positions and response latencies. A: scatter plots of the relationship between response latency and laminar position for layers 2/3 cells in S1 (Ai) and A1 (Aii). B: scatter plots of the relationship between 1st EPSP amplitude at minimal stimulation intensity and response latency for layers 2/3 neurons in S1 (Bi) and A1 (Bii).

