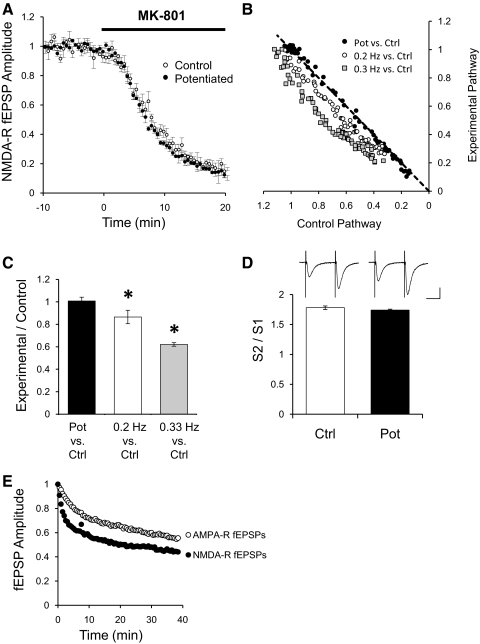
Fig. 3.
Potentiation does not change probability of release. A: normalized peak amplitude of NMDAR fEPSPs for a control pathway (○; n = 8) or a potentiated pathway (●) after addition of 40 μM MK-801 to the bath. Field potentials were recorded in CA1 region of the hippocampus in ACSF with 0.1 mM Mg+2, 2 μM NBQX, and 100 μM PTX. Field potentials were evoked by stimulation of 2 independent pathways with bipolar electrodes placed on Schaffer collaterals. One pathway was potentiated by stimulating at 0.01 Hz for 50 min and returned to 0.1 Hz. Control pathway was constantly stimulated at 0.1 Hz. After stabilization of the potentiated pathway, MK-801 was added to the bath (40 μM). B: normalized peak amplitude of NMDAR-mediated fEPSPs from the potentiated pathway plotted against the normalized peak amplitude from the control pathway during the application of 40 μM MK-801 (●). Gray squares and open circles are normalized peak amplitude of NMDAR-mediated fEPSPs from a pathway stimulated at 0.2 or 0.3 Hz plotted against their respective control pathway stimulated at 0.1 Hz during the application of 40 μM MK-801. C: quantification of the blockade by 40 μM MK-801 of NMDAR-mediated fEPSPs. Ratio of the fEPSP peak amplitude of the potentiated pathway over the amplitude of the control pathway at 50% of the total MK-801 blockade (filled bar, n = 8). Ratio of the fEPSP peak amplitude from a pathway stimulated at 0.2 Hz (n = 4), or 0.3 Hz (n = 4), over their respective control pathway stimulated at 0.1 Hz at 50% of the total MK-801 blockade. *P < 0.05 Student's t-test. D: paired pulse facilitation of AMPAR-dependent fEPSPs. AMPAR-dependent fEPSPs were recorded in CA1 region of the hippocampus in regular ACSF (1.3 mM Mg+2). Field potentials were evoked at 0.1 Hz by stimulation of 2 independent pathways with bipolar electrodes placed on Schaffer collaterals. After obtaining a stable baseline, 1 pathway was suspended for 20 min to potentiate it. After potentiation, several trials of 2 stimuli 50 ms apart were delivered to the control pathway (open bar) or to the potentiated pathway (filled bar; n = 16), and the ratio of the fEPSPs amplitude calculated. Insets: sample traces from the control pathway or the potentiated pathway. Bars = 20 ms and 0.4 mV. E: normalized decay phase of potentiation for AMPAR- and NMDAR-mediated fEPSPs responses. Decay phases from Figs. 1B and 2A were normalized to the maximal potentiation.

