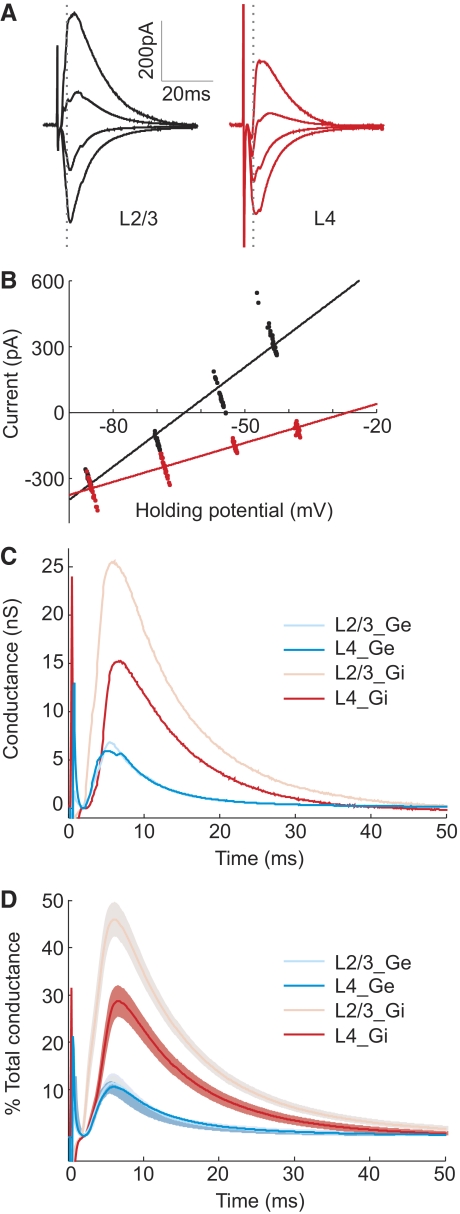
Fig. 3.
Different amplitudes of L2/3 and L4 inhibitory conductances. A: synaptic currents evoked by extracellular stimulation in L2/3 (black) and L4 (red) recorded at 4 different holding potentials (−85, −70, −55, and 45 mV) with 3 mM QX-314 in recording pipette. Each trace was averaged from 22 trials. B: instantaneous synaptic currents at 3.5 ms after extracellular stimulation (dotted gray lines in A) are plotted against holding potentials. Each point represents data recorded in each trial. Fits were performed using linear regression. C: excitatory and inhibitory conductances evoked by stimulation in each pathway for the cell shown in A and B. D: conductances averaged across 24 experiments. In each experiment, each conductance was normalized by the total peak amplitude conductance before averaging across experiments. Shaded region, ±SE.

