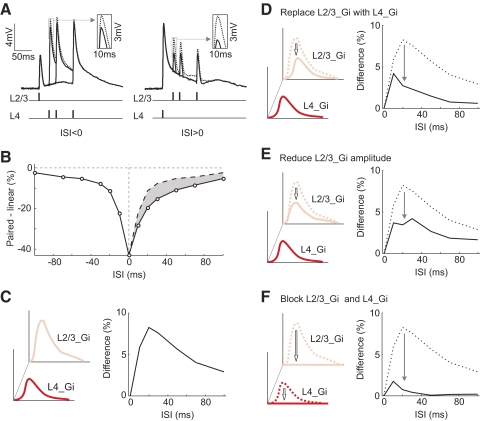
Fig. 4.
Simulation of voltage traces from excitatory and inhibitory conductances. A: reconstructed voltage traces using the measured conductances shown in Fig. 3D. B: integration window for reconstructed responses. Shaded area, difference between the dashed (ISI < 0) and solid curve (ISI > 0). C: difference curve. Left: schematic illustration of L2/3_Gi and L4_Gi. Right: difference curve corresponding to shaded area in B. D: equalizing L2/3_Gi and L4_Gi. Left: schematic illustration of replacing L2/3_Gi with L4_Gi. Right: difference curve before (dotted) and after (solid) L2/3_Gi replacement. E: similar to D, with L2/3_Gi amplitude reduced to L4_Gi amplitude, but with the original L2/3_Gi waveform retained. F: similar to D, with L2/3_Gi and L4_Gi blocked by setting both to 0.

