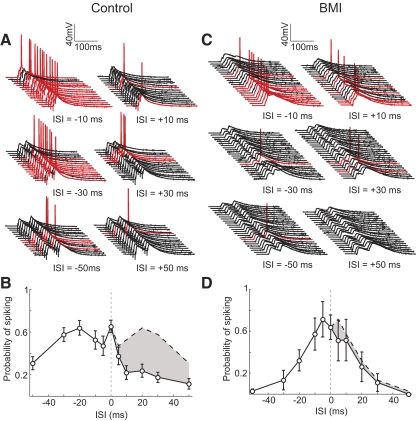
Fig. 6.
Dependence of spike output on ISI. A: responses to multiple trials of paired stimulation at 3 different ISIs (10, 30, and 50 ms) in an example cell, showing trials with (red) and without (black) spiking. B: probability of spiking plotted against ISI (n = 19). Error bar, ±SE. C: similar to A, for an experiment performed in the presence of 3.3 μM. BMI. D: probability of spiking vs. ISI in the presence of BMI (n = 4). Error bar, ±SE.

