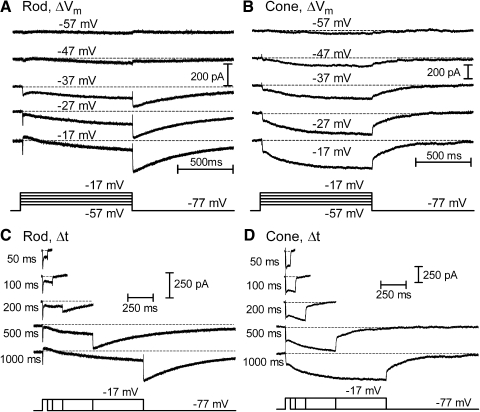
Fig. 8.
Tail currents evoked by depolarizing test steps over a range of voltages (−57 to −17 mV) and durations (50 ms to 1 s). A and B each show the currents evoked in a rod (A) and cone (B) by changes in the amplitude of a 1-s test step from −57 to −17 mV (10-mV increments). Small inward ICa is detectable during steps to −57 mV and above. Cl(Ca) tail currents become visible with steps to −47 mV and above. C and D each illustrate currents evoked by changing the duration of a strong test step (−77 to −17 mV) from 50 ms to 1 s in a rod (C) and cone (D). Inward ICa values were evoked by the step and Cl(Ca) tail currents were observed following termination of the test step with pulses of ≥200 ms in these examples. Passive membrane resistance (Rm) and membrane capacitance (Cm) were subtracted using a P/8 protocol. ECl = −39 mV.

