Fig. 8.
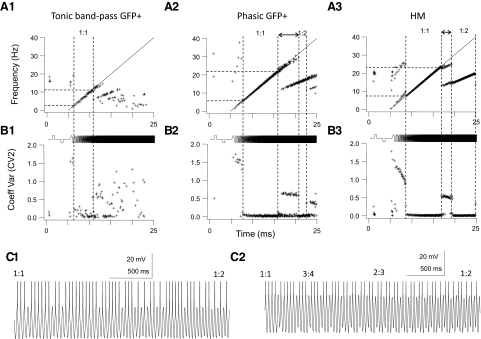
Phase-locking properties in GFP+ cells and HMs differ. Top row (A1–A3): instantaneous firing frequency (f) plotted against time (t) for a tonic band-pass GFP+ cells (A1); a phasic GFP+ cell (A2); and an HM (A3) stimulated sequentially with a step (500 ms) depolarization, a step (500 ms) hyperpolarization, and a chirp stimulus (starting at t = 5 s and ending at t = 25 s, chirp rate 2Hz/s), all at the same amplitude (stimulus shown schematically at the bottom). Stimulus amplitude was 3-fold the threshold amplitude (3T) for all 3 neurons. Straight line is the chirp frequency (0–40 Hz) plotted against time. The 1:1 and 1:2 phase-locking regimes are indicated by the vertical dashed lines. Middle row (B1–B3): the local interspike variability as measured by the Holt coefficient of variation (CV2; see methods) plotted against time for the corresponding f–t plots above. Phase-locking (1:1 or 1:2) regions have the lowest CV2 values. The CV2 in B1 in the 1:1 region is higher than that in the cells in B2 and B3, indicative of more irregular firing even during phase-locking in this cell type. Even though it fired tonically at depolarized membrane potentials the cell in B1 had delayed onset characteristics when stimulated at resting membrane potential. C: membrane voltage traces shown on an expanded timescale taken from the transition region between 1:1 and 1:2 phase-locking, as indicated by the double-ended arrows in A2 and A3. The trace in C1 was taken from the phasic GFP+ cell in A2 and the trace in C2 from the HM in A3. Note the regions of 3:4 and 2:3 firing during the transition between 1:1 and 1:2 phase-locking in the HM (C2) and the irregular firing during this transition in the phasic GFP+ cell (C1). APs are clipped at the top.

