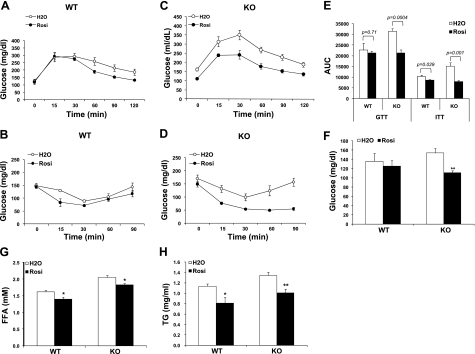
Figure 1.
Effect of Rosi on glucose tolerance, insulin sensitivity, and dyslipidemia in Lcn2−/− mice. A, B) Glucose (A) and insulin (B) tolerance tests conduced in WT mice fed an HFD (n=6–8, age=19–20 wk). C, D) Glucose (C) and insulin (D) tolerance tests conduced in Lcn2−/− mice fed an HFD (n=6–8, age=19–20 wk). E) Results of GTTs and ITTs, presented as area under the curve (AUC). F–H) Unfed-state blood glucose levels (F), serum FA level (G) and blood triacylglycerol levels (H). Data are represented as means ± se. KO, Lcn2−/− knockout mice. *P < 0.05; **P < 0.01.

