Figure 1.
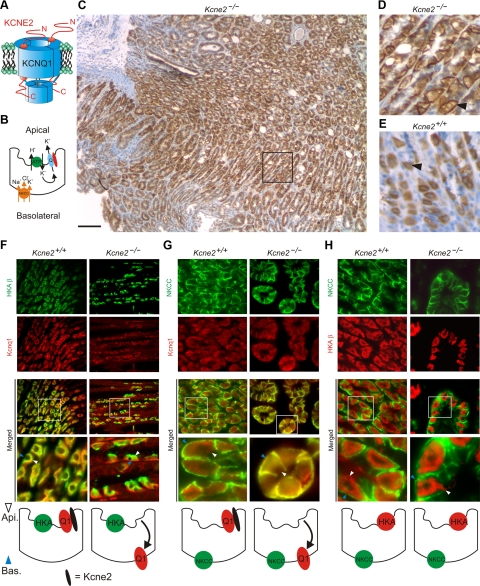
Reversed Kcnq1 trafficking in PCs of Kcne2−/− mice. A) Cartoon of a KCNQ1–KCNE2 complex. B) Cartoon of a PC showing location of HKA, NKCC1, and the KCNQ1–KCNE2 channel. C) KCNQ1 immunostaining (IS) in Kcne2−/− gastric mucosa. Scale bar = 100 μm. D) KCNQ1 IS in Kcne2−/− gastric mucosa (black box from panel C). Arrowhead indicates basolateral KCNQ1 staining. E) KCNQ1 IS in Kcne2+/+ gastric mucosa (same scale as panel D). Arrowhead indicates diffuse KCNQ1 staining due to localization at the invaginated apical membrane. F–H) Top: exemplar IF colabeling of Kcne2+/+ and Kcne2−/− gastric glands as indicated. “Merged” indicates merged view of the 2 panels above; bottom merged panel shows expanded view of the boxed region in the top merged panel. Yellow indicates colocalization. Blue arrowheads, PC basolateral side; white arrowheads, PC apical side. Representative of results from ≥2 mice, 3–5 sections/mouse/genotype. Bottom: cartoons summarizing IF data. F) Kcnq1 (red) and HKA β subunit (green). G) Kcnq1 (red) and NKCC (green). H) HKA β subunit (red) and NKCC (green). Width of view (except bottom merge): 100 μm (F); 75 μm (G, H).

