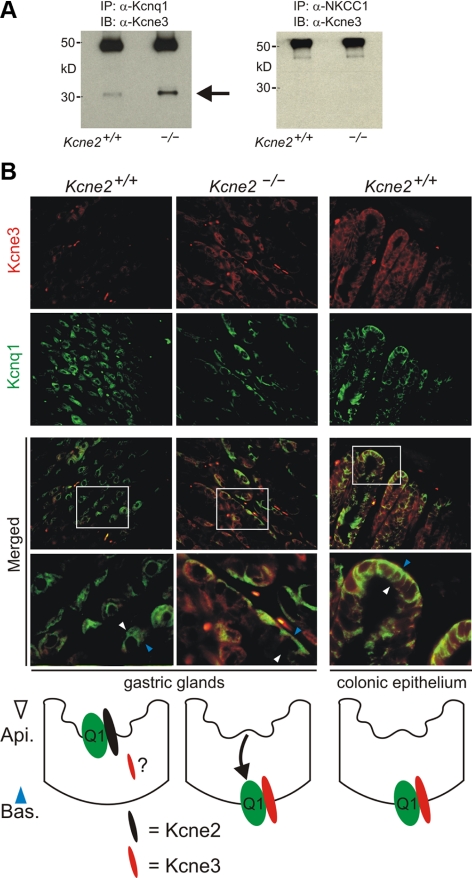
Figure 3.
Remodeled Kcne3 forms basolateral complexes with Kcnq1 in Kcne2−/− PCs. A) Co-IPs showing complex formation of Kcne3 with Kcnq1 (left panel) but not with NKCC1 (right panel) from mouse fundic membrane fractions. IPs of fractions from Kcne2+/+ and Kcne2−/− mice were prepared using antibodies raised against Kcnq1 or NKCC1, and Western blots were performed with anti-Kcne3 antibody. Numbers indicate migration of molecular mass markers (kDa). Arrow indicates expected mature Kcne3 migration distance. Top bands are precipitated antibodies. Representative of n = 2 experiments/antibody, with each prep pooled from 3–5 mouse stomachs/genotype. B) Top: exemplar IF labeling of Kcne3 (red) and Kcnq1 (green) in Kcne2+/+ or Kcne2−/− gastric glands, or Kcne2+/+ colonic crypts, as indicated. Merged panels show merged views of the 2 panels above; bottom merged panel shows expanded view of the boxed region in the top merged panel. Yellow indicates colocalization. Width of view (except bottom merge): 100 μm. Representative of results from at least two mice, 3–5 sections/mouse/genotype. Bottom: cartoons summarizing IF data.

