Figure 4.
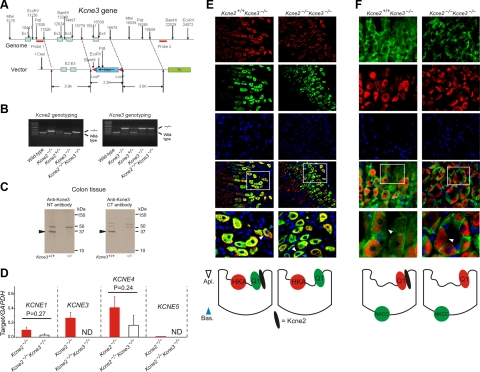
Kcne3 deletion restores apical trafficking of Kcnq1 in Kcne2−/− mice. A) Targeting strategy for genomic deletion of Kcne3 from mice. B) Agarose gels showing PCR genotyping of wild-type, heterozygous, and homozygous single-knockout Kcne2−/− and Kcne3−/− mice, and double-knockout Kcne2−/−Kcne3−/− mice. C) Western blots of Kcne3 protein in membrane fractions from colonic crypts of Kcne3+/+ and Kcne3−/− mice as indicated, using an in-house antibody raised against a Kcne3 N-terminal epitope (left panel), and a commercial antibody (Alomone) raised against a Kcne3 C-terminal epitope (right panel). Migration distance of molecular mass markers is indicated at right. Arrows indicate band at 37 kDa unique to wild-type tissue. D) qRT-PCR analysis of remodeling of the fundic Kcne expression profile by targeted deletion of both Kcne2 and Kcne3; expression level expressed as a ratio to that of reference gene GAPDH amplified in parallel each time; n = 10 mice/single gene deletion genotype; n = 5 mice/double gene deletion genotype. ND, not determined (for Kcne3, not measured in Kcne2−/−Kcne3−/− mice; for Kcne5, unable to detect signal conforming to quality controls as described in Materials and Methods). Error bars = sem. E, F) Top: exemplar IF colabeling of Kcne2+/+ Kcne3−/− and Kcne2−/−Kcne3−/− gastric glands as indicated. Bottom two IF panels are merged views of the 3 panels above; bottom merged panel shows expanded view of the boxed region in the top merged panel. Blue arrowheads, PC basolateral side; white arrowheads, PC apical side. Counterstained with DAPI (blue). Representative results from ≥2 mice, 3–5 sections/mouse/genotype. Bottom: cartoons summarizing IF data. E) Kcnq1 (green) and HKA β subunit (red). F) Kcnq1 (red) and NKCC1 (green). Width of view (except bottom merge): 100 μm (E); 50 μm (F).

