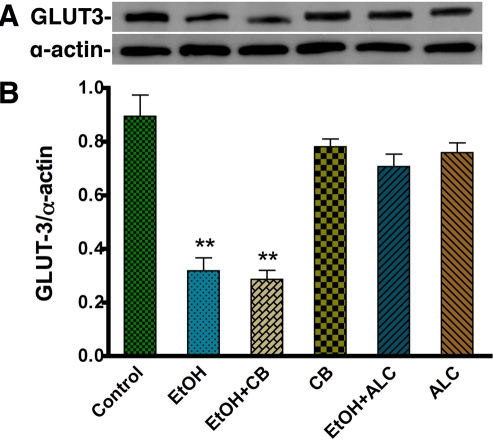
Figure 6.
Western blot analysis for GLUT3 expression in EtOH treated human neurons. A-B. Effects of EtOH (24 hr treatment) on GLUT3 (45 kDa) protein levels in human neurons. Bar graph shows the results, and are expressed as the ratio of GLUT3 to that of α-actin bands, and presented as mean values (± SEM; n = 5). **Statistically significant, p<0.01, compared with controls.

