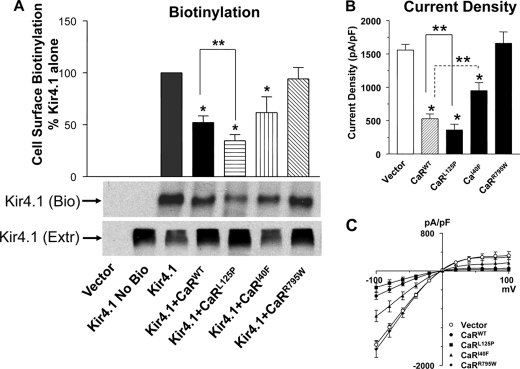
FIGURE 1.
Effect of CaR mutants on Kir4.1 cell surface expression (A) and current density (B and C). cDNAs coding for Kir4.1 and the CaR mutants were expressed transiently in HEK-293 cells. A, cell surface expression of Kir4.1 was measured using cell surface biotinylation. Ten μg of cell surface biotinylated protein was used for each lane in each blot, and Kir4.1 was identified using the Kir4.1 antibody. The top panel shows summary data (n = 7, mean ± S.E.). The bands corresponding to biotinylated Kir4.1 were quantitated using densitometry (Scion Image), and the values in each experiment were normalized for the level of expression of Kir4.1 alone. The middle panel Kir4.1 (Bio) shows a representative blot for biotinylated Kir4.1, and the bottom panel shows a corresponding cell extract blotted for Kir4.1 (Extr). B, top panel, summary data for whole cell current density ± S.E. (n = 8). All cells expressed Kir4.1 and CaR constructs as shown. C, the representative voltage-capacitance curves for Kir4.1 and CaR constructs are as shown. *, p < 0.05 compared with Kir4.1 alone (ANOVA). ** p < 0.05 between groups indicated (ANOVA).

