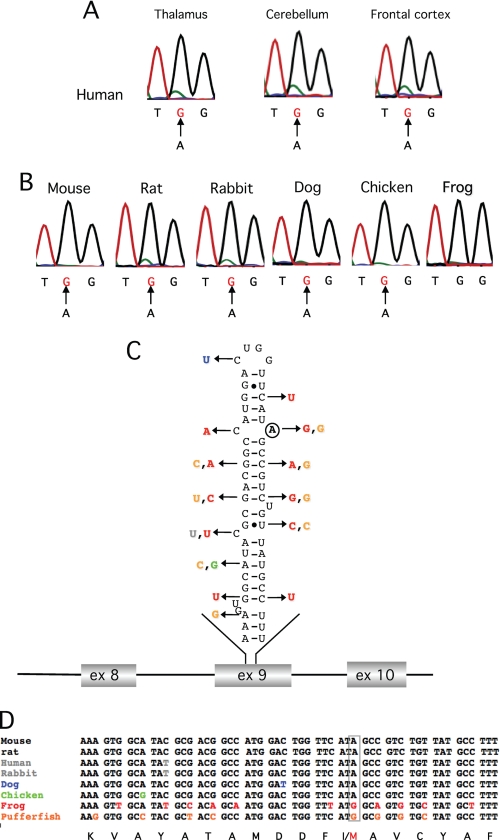
FIGURE 1.
Conserved editing of the Gabra-3 transcript. A, frequency of editing at the I/M site in Gabra-3 in the thalamus, cerebellum, and frontal cortex of the human brain as indicated. The arrows indicate the A to G change as a result of A-to-I editing. B, editing frequency at the I/M site in Gabra-3 in total brain from mouse, rat, rabbit, dog, and chicken. Pipid frog has a genome encoded G at the I/M site and is therefore not edited. C, the predicted stem-loop structure of the Gabra-3 transcript at the I/M site in mouse (mGabra-3). A circle indicates the edited adenosine. The arrows indicate nucleotide substitutions in Gabra-3 of other species as shown in D. D, sequence alignment of the gabra-3 gene, showing the part of exon 9 that forms the putative stem loop in different species. The site of editing is boxed in gray. The amino acid sequence is shown at the bottom with the I/M site indicated.

