FIGURE 6.
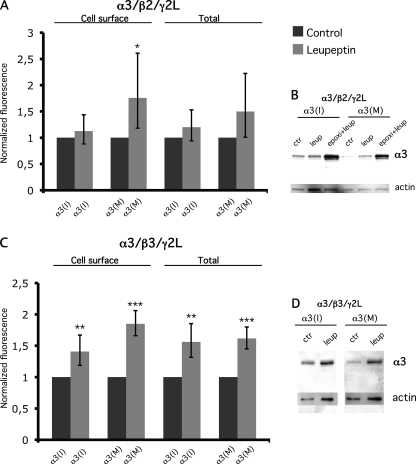
Inhibition of the lysosomal pathway increase the surface levels of the α3(M) subunit. Relative fluorescence intensity and Western blot analysis of α3 in control and leupeptin-treated cells. A, cell surface and total α3 levels in control and leupeptin-treated cells transfected with α3(I) or α3(M), β2, and γ2L subunits, ratio (1:1:1). The rate of epoxomicin-treated cells was normalized to untreated cells (n = 3). The values are represented as the means with 95% CI. A more prominent stabilization of cell surface α3(M) was observed compared with α3(I) in leupeptin-treated cells. When total expression was measured, the average relative intensity of both α3(I) and α3(M) was increased in leupeptin-treated cells compared with controls, although the stabilization was stronger for the α3(M) subunit. B, Western blot analysis of whole cell lysates from the same cells as in A and experiments where the proteasome and lysosome were inhibited. ctr, control; epoxi, epoxomicin; leup, leupeptin. C, the cell surface and total level of α3 in cells transfected with α3(I) or α3(M), β2, and γ2L subunits (n = 3). The relative cell surface intensity of α3 in leupeptin-treated cells normalized to untreated cells is presented as indicated on the left. A stabilization of both α3(I) and α3(M) was observed. The relative intensity of the total α3 levels in leupeptin-treated cells normalized to untreated cells as indicated on the right. *, p < 0.05; **, p < 0.01; ***, p < 0.001. The error bars represent 95% CI. D, Western blot analysis of whole cell lysates from the experiments represented in C using an α3 antibody. Actin was detected and used as a loading control.

