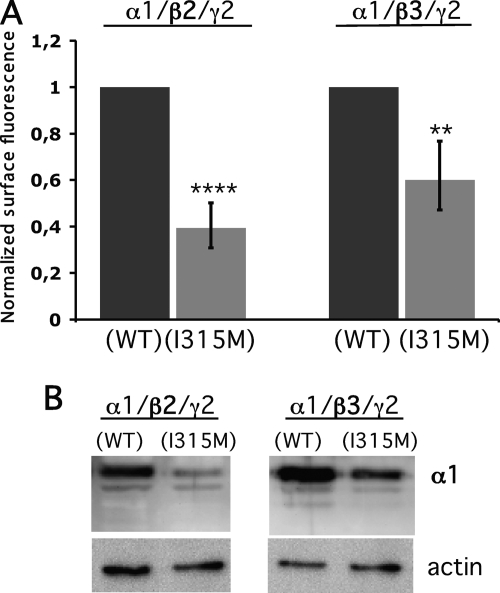
FIGURE 7.
Cell surface presentation of α1 is affected by a mutation mimicking the edited I/M site. Relative fluorescence intensity and Western blot analysis of wild-type α1(WT) or mutated α1(I315M) expression in HEK293 cells. A, average surface intensity of α1 when co-transfected with either β2 and γ2L or β3 and γ2L expression vectors in a 1:1:1 ratio. The relative cell surface intensity of α1(I315M) is presented when normalized to wild-type α1 (n = 3). **, p < 0.01; ***, p < 0.001. The error bars represent 95% CI. B, Western blot analysis of whole cell lysates from experiments represented in A. An α1 antibody was used to detect the total protein concentration. Actin was detected and used as a loading control.

