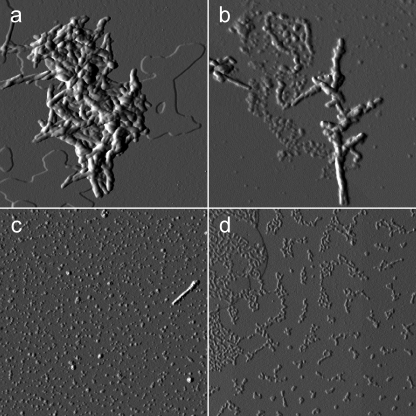
FIGURE 9.
Tapping mode AFM images (amplitude data) showing the evolution of the morphology of preformed β2-m fibrils as a function of the incubation time with doxycycline (300 μm). a, immediately after drug addition. b, at 24 h, when partial fibril dissolution into smaller units becomes visible. c, at 72 h, corresponding to maximum oligomer release and minimum cell viability, with initial rearrangement of the oligomers into more complex structures. d, at 7 days, when the sample is mostly aggregated into structures with uniform height (1 nm). Scan size: 2 μm (a, c, and d) and 1 μm (b).

