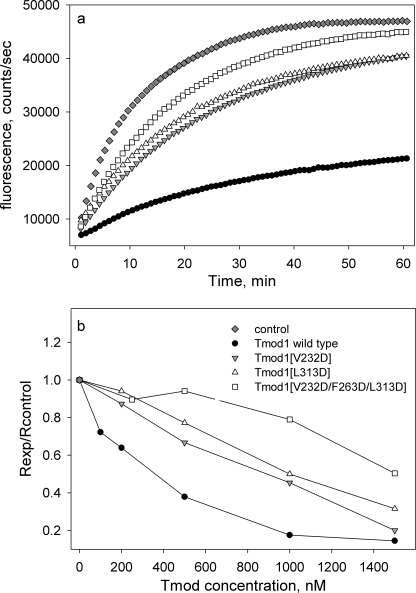
FIGURE 9.
Effect of mutations in the Tmod1 C-terminal domain on TM-independent actin capping. a, pyrene fluorescence that measures actin polymerization is plotted versus time. Initial protein concentrations were 6 nm gelsolin-capped filaments, 1.1 μm G-actin, and 1 μm WT or mutant Tmod1. b, dependence of Tmod1 concentration on inhibition of actin polymerization. The polymerization data were fitted to a three-parameter exponential equation using SigmaPlot and initial polymerization rates (Rexp) were calculated as the first derivative at time 0. Rexp values were then normalized by the initial rate obtained for polymerization of actin on gelsolin-capped actin seeds (Rcontrol).

