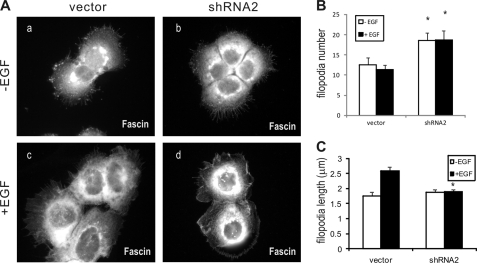
FIGURE 4.
Toca-1 knockdown cells have defects in EGF-induced filopodia formation. A, representative epifluorescence micrographs are shown for A431 vector control (a and c) and Toca-1 knockdown cells (shRNA2; b and d) plated on gelatin-coated coverslips prior to serum starvation (a and b) and treatment with EGF (100 ng/ml for 15 min; c and d). Cells were fixed in methanol and permeabilized, and filopodia were stained using fascin mAb. B, the graph depicts the average number of filopodia per cell ± S.E. (error bars) between cell lines in each condition (n = 20–30 cells). *, statistically significant differences (p < 0.05) between Toca-1 knockdown and vector control cells based on paired Student's t test. C, the graph depicts the average length of filopodia ± S.E. between cell lines in each condition (n = 20 cells for −EGF, and n = 49 for +EGF). *, statistically significant difference (p < 0.05) between Toca-1 knockdown and vector control cells based on paired Student's t test (n = 40 cells).

