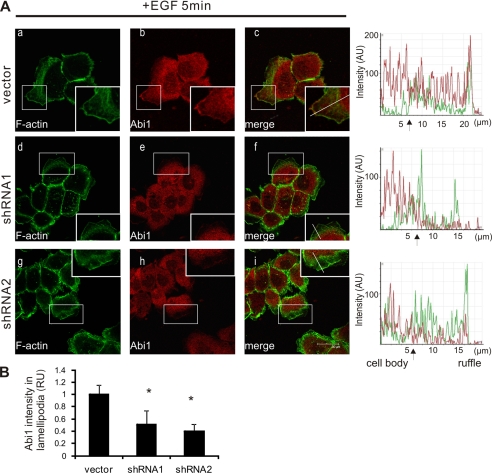
FIGURE 7.
Toca-1 promotes recruitment of Abi1 to lamellipodia of EGF-treated A431 cells. A, A431 vector, shRNA1, and shRNA2 cell lines were serum-starved and treated with EGF (100 ng/ml) for 5 min, and staining of F-actin and endogenous Abi1 was performed as described under “Experimental Procedures.” Representative confocal microscopy images for F-actin (green), Abi1 (red), and a merged image are shown for control and Toca-1 knockdown cells. The insets reflect a higher magnification of the boxed areas, and arrows indicate some areas of membrane ruffles. Intensity profiles for green and red channels across a representative lamella (indicated by lines within insets) are shown on the right for each cell line. Scale bar, 30 μm. B, the graph depicts quantification of the relative Abi1 staining intensity (relative units (RU)) within lamellipodia ± S.E. (error bars) (>30 cells analyzed) for Toca-1 knockdown cells relative to vector control cells, as described under “Experimental Procedures.” *, significant difference between Toca-1 knockdown and vector control cells based on paired Student's t test (p < 0.05).

