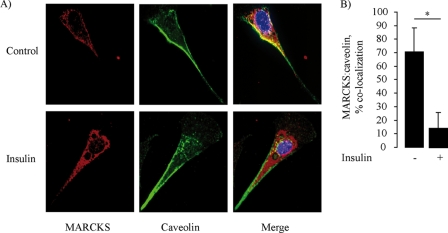
FIGURE 3.
Insulin-stimulated translocation of MARCKS in cultured endothelial cells. Shown are representative photomicrographs of endothelial cells treated with insulin (100 nm) or vehicle, fixed, and then stained with antibodies directed against MARCKS or caveolin-1. Detection was carried out with secondary antibodies coupled to Alexa Fluor 488 or Alexa Fluor 568, respectively. Nuclei were stained with 4′,6-diamidino-2-phenylindole. A, representative images of the staining pattern obtained for MARCKS and caveolin antibodies, analyzed in two-dimensional projections of three-dimensional optical stacks that where obtained by white light confocal imaging (magnification ×60). The MARCKS staining pattern is shown in red; caveolin in green; and colocalization in yellow. B, statistical analyses obtained using the MetaMorph colocalization analysis module. Each bar represents the mean ± S.E. of five independent experiments that yielded similar results. *, p < 0.05.

