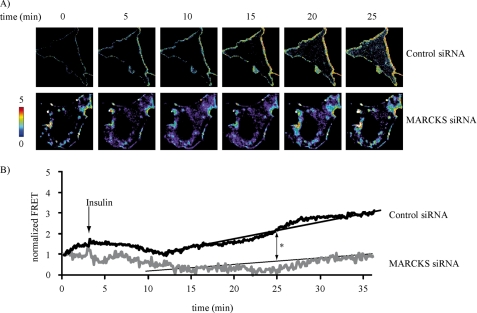
FIGURE 5.
FRET-based analysis of insulin-stimulated PIP2 accumulation following siRNA-mediated MARCKS knockdown. A, representative images of endothelial cells transfected with PIP2 biosensor plasmids plus either control or MARCKS siRNA constructs; the individual panels show the time lapse of FRET images obtained following treatment with insulin (100 nm) or vehicle at the indicated times. B, pooled quantitative data from six independent experiments. The data are expressed as change of FRET ratio over time, reflecting the abundance of PIP2 at the plasma membrane. *, p < 0.01 (n = 6), as compared with control treated cells.

