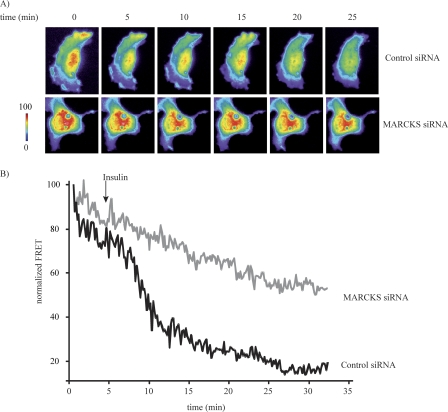
FIGURE 8.
Analysis of N-WASP activation using a FRET based N-WASP biosensor after siRNA-mediated MARCKS knockdown. A, representative images of endothelial cells transfected with the N-WASP FRET biosensor plasmid plus either control or MARCKS siRNA constructs. Following addition of insulin, cells were monitored for the appearance of YFP emission after CFP excitation; the individual panels show the time lapse of FRET images obtained following treatment with insulin (100 nm) or vehicle at the indicated times. Parameter correction was carried out with the MetaMorph FRET module. B, pooled quantitative data from six independent experiments. The data are expressed as the change of FRET ratio over time, which reflects the degree of N-WASP activation. *, p < 0.01 (n = 6), as compared with control siRNA-transfected cells.

