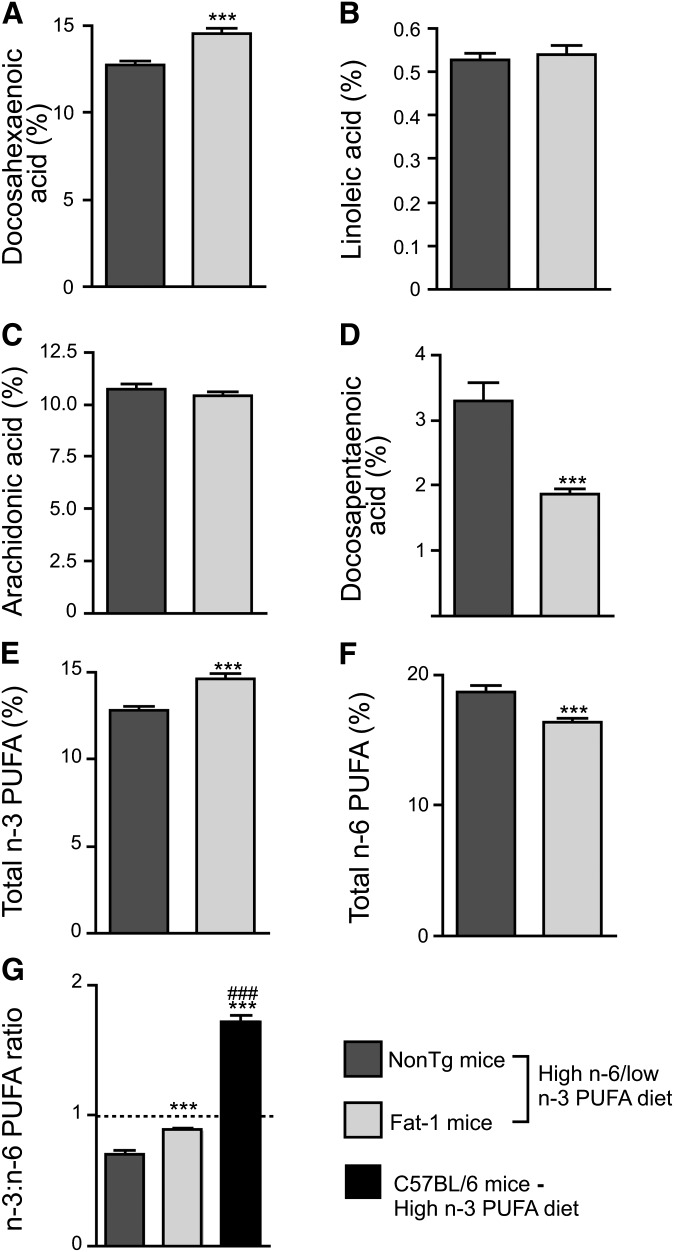
Fig. 1.
Fat-1 transgenic mice display significant changes in fatty acid profiles. As assessed in the frontal cortex by gas chromatography, DHA (A) and total n-3 PUFAs (E) were increased in Fat-1 mice compared with NonTg mice. Despite the absence of differences in linoleic (B) and arachidonic acids (C), n-6 docosapentaenoic acid (D) and total n-6 PUFAs (F) were significantly decreased in Fat-1 mice. These alterations led to an increase in the brain n-3:n-6 PUFA ratio reaching nearly 1:1, but the fat-1 transgene was comparatively less potent than dietary DHA supplementation in increasing the brain n-3:n-6 PUFA ratio [see previous published data (4)] (G). Data are expressed as a percentage of total fatty acids. *** P < 0.001 versus NonTg mice and ### P < 0.001 versus NonTg and Fat-1 mice.

