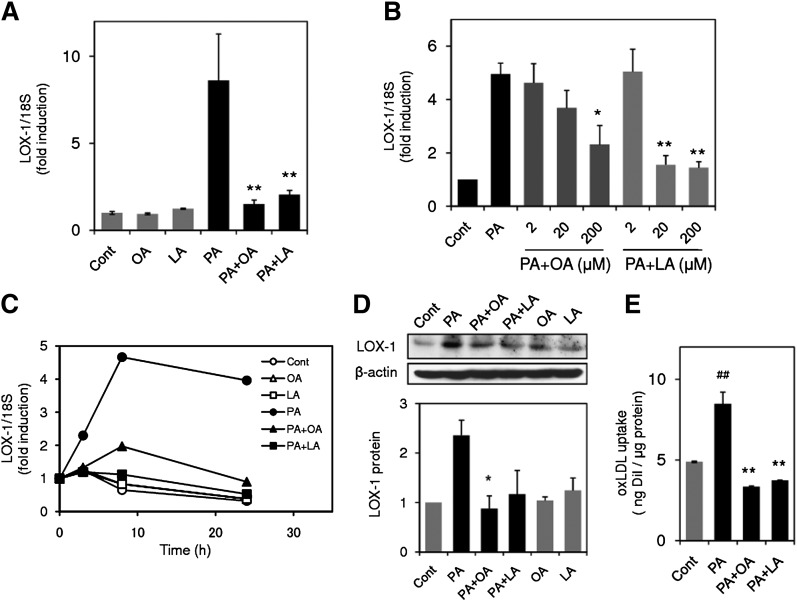
Fig. 5.
Oleic acid (OA) and linoleic acid (LA) inhibit PA-induced LOX-1 upregulation. A: LOX-1 gene expression in THP-1 cells stimulated with 200 μM PA in the presence or absence of OA (200 μM) and LA (200 μM) for 24 h. LOX-1 expression was quantified by real-time PCR and normalized relative to 18S rRNA. Data are expressed as means ± SE from four independent experiments. ** P < 0.01 versus PA. B: Concentration-dependent inhibition of PA-induced LOX-1 upregulation by OA and LA. LOX-1 expression in THP-1 cells stimulated with 200 μM PA in the presence or absence of OA and LA at the indicated concentration for 24 h. Data are expressed as means ± SE of three independent experiments. ** P < 0.01, * P < 0.05 versus PA. C: Time course of changes in LOX-1 expression in THP-1 cells stimulated with 200 μM PA with or without OA (200 μM) and LA (200 μM). Data are average values from two independent experiments. D: (top) Representative Western blot for LOX-1 from three independent experiments, which showed the same trends as in cells treated with 200 μM PA for 24 h. (bottom) Bar graphs show the results of densitometric analysis of Western blots for LOX-1 protein. Data are expressed as means ± SE from three independent experiments. E: PA promotes uptake of oxidized LDL (oxLDL), and OA or LA prevents enhanced uptake of oxLDL. Cells were incubated with 200 μM PA in the presence or absence of 200 μM OA or LA for 24 h, followed by incubation with DiI-labeled oxLDL for 4 h. After washing and lysis, fluorescence of DiI in the lysate was measured at 530/590 nm. Data are expressed as means ± SE of three independent experiments. ## P < 0.01 versus control group (Cont), ** P < 0.01 versus PA.

