Fig. 6.
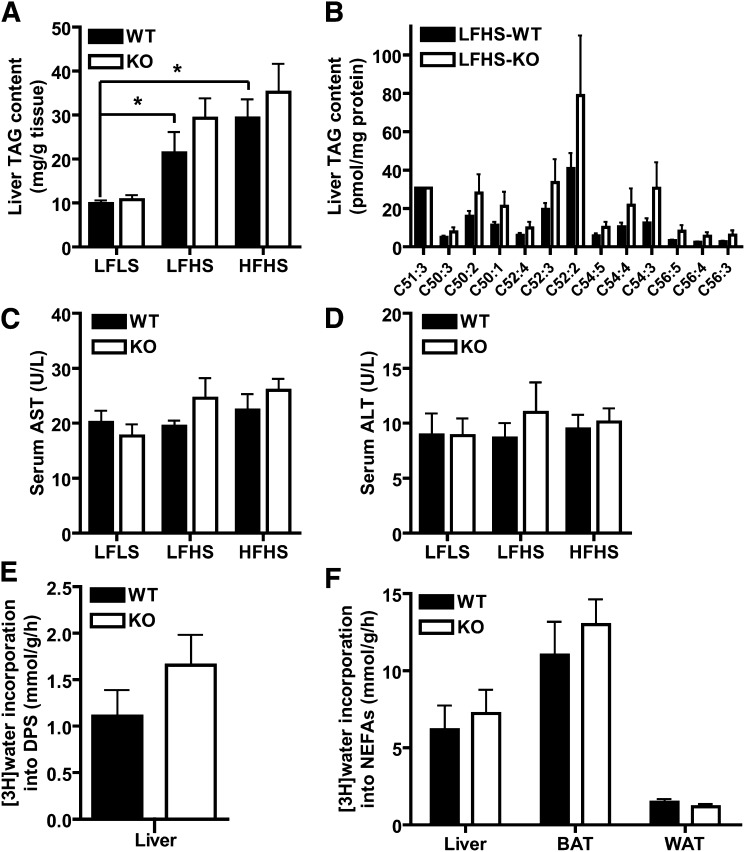
Lipid homeostasis in Pnpla3 knockout (KO) mice. (A) Liver TAG content normalized to tissue weight in WT and KO mice fed low-fat low-sucrose (LFLS), low-fat high-sucrose (LFHS), or high-fat high-sucrose (HFHS) diets (n = 6–11/group, male, 19 week-old, ad libitum-fed). (B) TAG molecular species normalized to protein content in liver of WT and KO mice fed LFHS diet (n = 7–10/group, male, 19 week-old, ad libitum-fed). TAG molecular species in liver lipid extracts were determined by electrospray ionization mass spectrometric analysis using C51:3 as an internal standard (tri 17:1). TAG species listed on the x axis are identified by the total number of carbons in the fatty acid moieties and the total number of double bonds in those fatty acids moieties (i.e., C51:3 represents a glycerol backbone esterified to three fatty acids with 17 carbons and 1 double bond each). (C–D) Serum aspartate aminotransferase (AST) (C) and alanine aminotransferase (ALT) (D) in WT and KO mice fed LFLS, LFHS, or HFHS diets (n = 6–11/group, male, 19 week-old, ad libitum-fed). (E–F) In vivo cholesterol (E) and fatty acid (F) biosynthesis in liver, BAT, and perigonadal WAT of WT and KO mice (n = 5/group, male, 8–9 week-old, chow diet). Fatty acid and cholesterol biosynthesis rates were calculated as micromoles of 3H-radioactivity from [3H]H2O incorporated into fatty acids or digitonin-precipitable sterols (DPSs), respectively, per gram of tissue per h as described in methods. * P < 0.05 by Student's t-test (for effect of diet, only comparisons in the WT group are shown).

