Fig. 3.
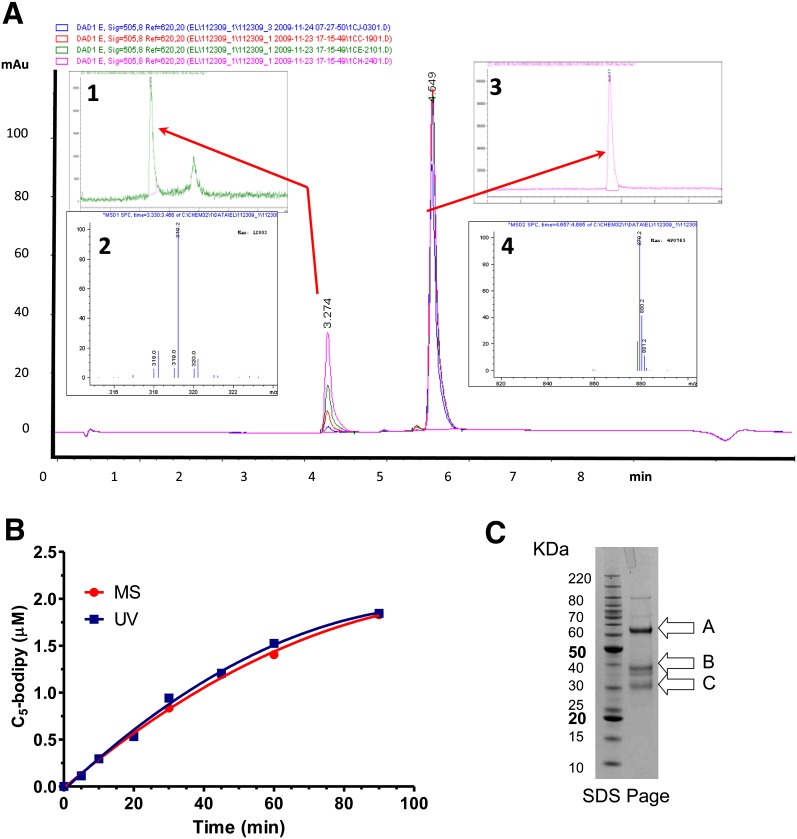
Cleavage of the PLA1 substrate by purified mouse EL as a function of time and confirmation of the products by LC/MS are shown. Purified mouse EL (200 nM) was incubated with the PLA1 substrate (10 µM) and monitored for cleavage as a function of time. A: Chromatograms for the 10, 30, 60, and 90 min samples: inset 1, LC/MS chromatogram (h/z 300–350) of the 60 min time point; inset 2, corresponding mass (M) signature of the 3.28 min peak from inset 1; inset 3, LC/MS chromatogram (h/z 800–900) of the 60 min time point; inset 4, corresponding mass signature of the 4.6 min peak from inset 3. B: Quantitation of the PLA1 substrate turnover as a function time monitored by (ultraviolet [UV]) A505 or by MS. C: A Coomassie blue-stained NuPage bis-Tris 4-12%-gradient gel showing purified mouse EL; (A) Full-length mouse EL with cleaved signal sequence amino acids (21–482); (B) Proprotein convertase cleaved mouse EL, N-terminal fragment (amino acids 21–330); (C) Proprotein convertase cleaved mouse EL, C-terminal fragment (amino acids 331–482). Bands were confirmed by N-terminal sequencing.

