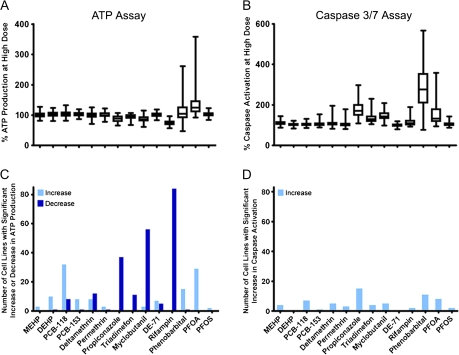
FIG. 2.
Population-wide variability in response to 14 model toxicants. Production of ATP (A and C) and activation of caspase-3/7 (B and D) in a panel of human lymphoblast cells were assessed 24 h after treatment with the highest dose (see Supplementary fig. 1) of each compound. Box and whiskers plots (A and B) were used to exhibit the variability in responses across the population. Bar graphs (C and D) demonstrate the number of cell lines with a significant response above (light bars) or below (dark bars) the vehicle control.

