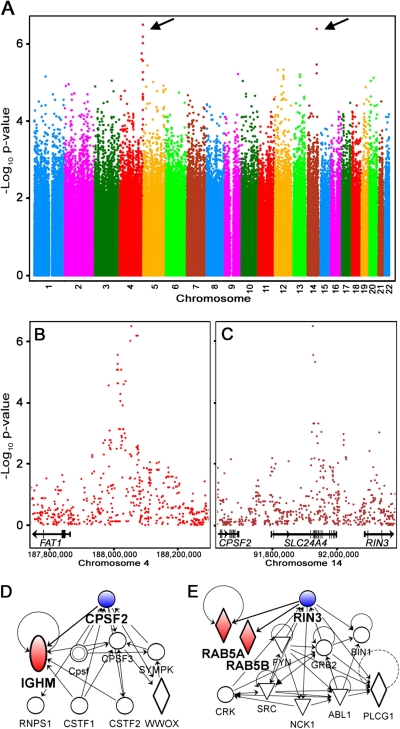
FIG. 5.
Genome-wide association scan of ATP production response to PFOA. (A) Genome-wide plot of SNPs and their degree of association with PFOA-elicited ATP production phenotype. Arrows indicate the loci with highest association. (B and C) Loci (500 kb) on chromosomes 4 and 14 flanking SNPs that are highly associated (p < 0.000001) with PFOA-elicited phenotype. Genes located in these loci are shown as well as gene networks for CPSF2 (D) and RIN3 (E). Shaded symbols (IGHM, RAB5A and RAB5B) indicate genes that have been identified as responsive to PFOA treatment in rat and chicken liver (Guruge et al., 2006; Yeung et al., 2007).

