
Figure 3.
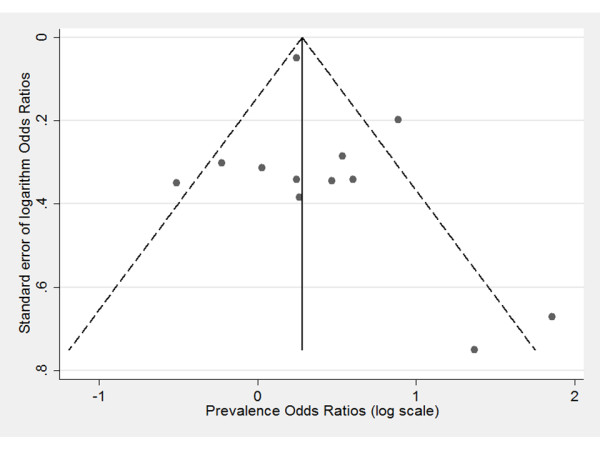
Funnel plot to assess publication bias. The full circles represent the 12 included study estimates of association between BV and prevalent cervical HPV infection. The size of association of each study is plotted on the horizontal axis, against the standard error on the vertical axis (on logarithmic scale). The vertical line in the funnel plot indicates the fixed-effects summary estimate, while the sloping lines indicate the expected 95% confidence intervals for a given standard error.